Sankey diagram
- 使用软件:Figma
- Plugin: Sankey Connect
- 展现数据流动的利器
- 案例:工作流描述
-
初始的思路是按照流程图来画,用 Excalidraw 插件画起来很快,但不够明晰。工作流也是处理数据流动的过程,适合用 Sankey diagram 来展示。
-
对比
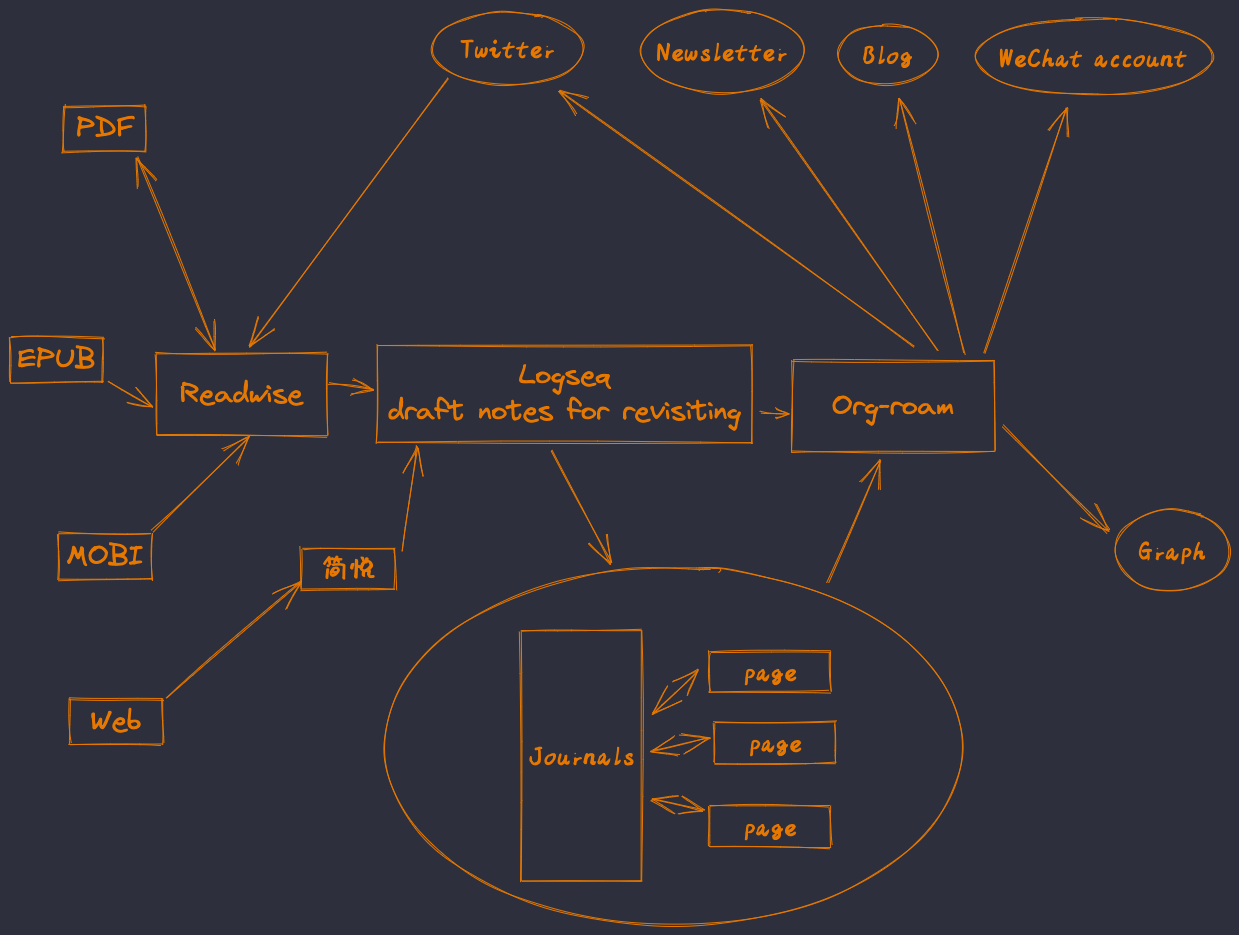
Figure 1: take-notes-draft
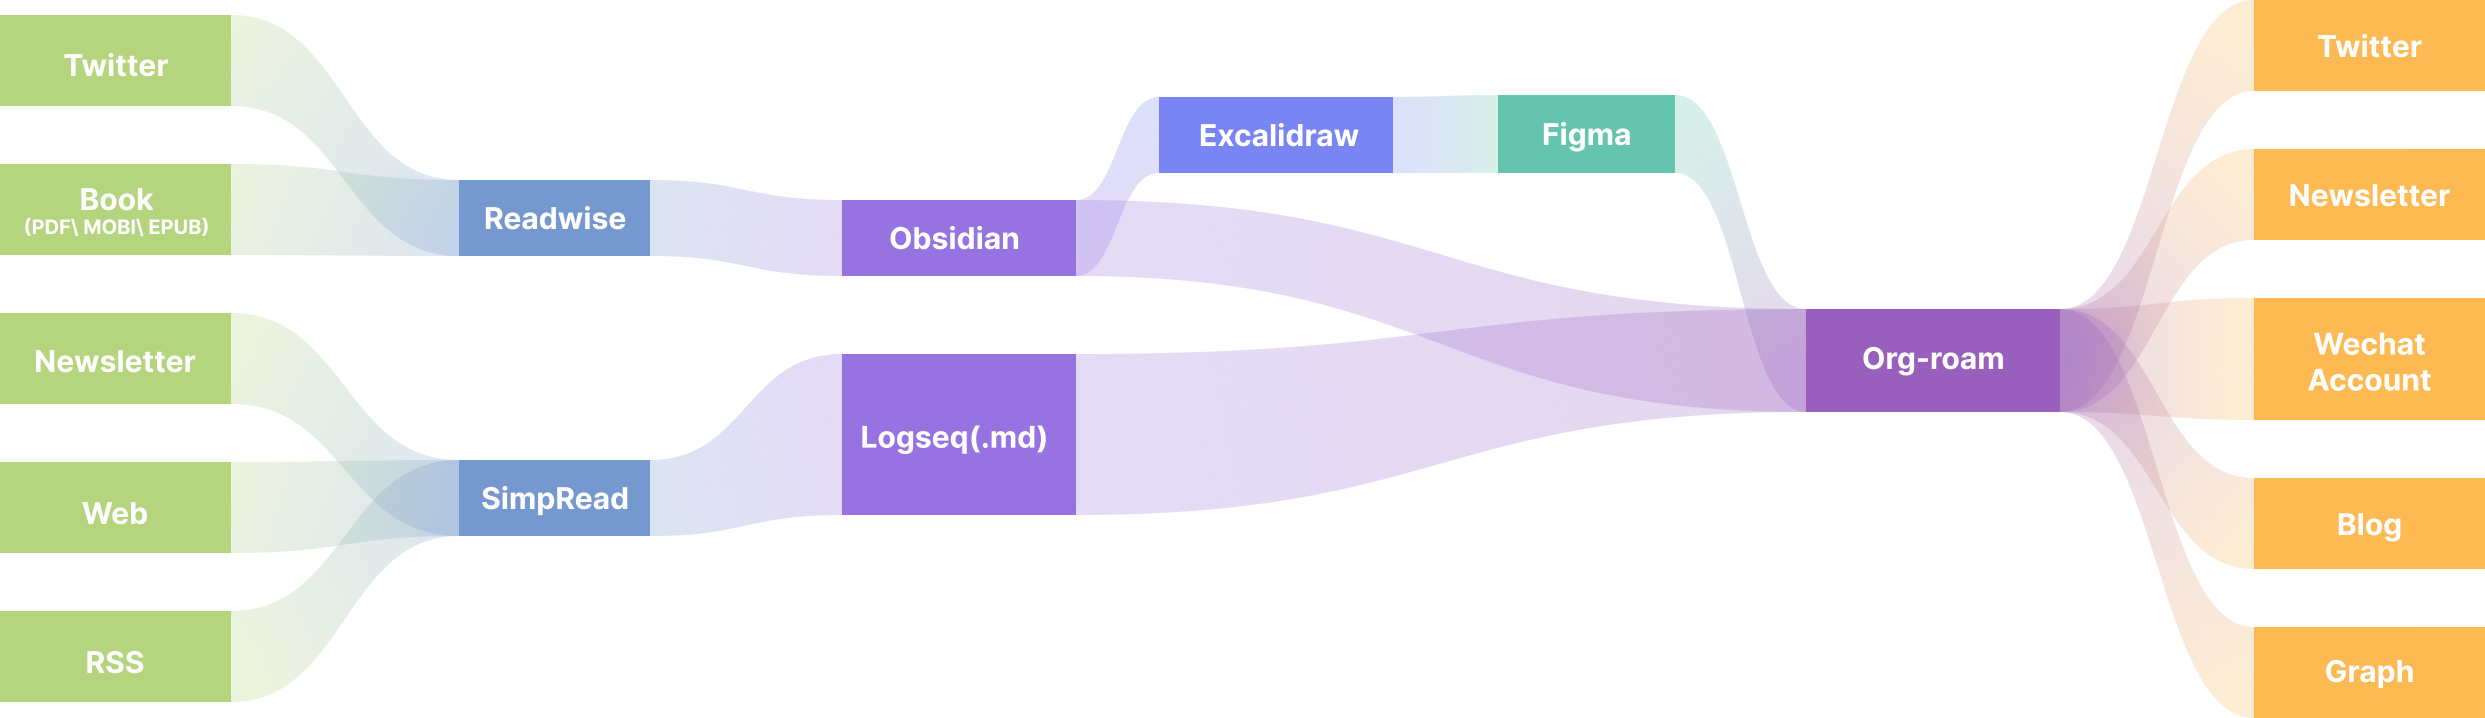
Figure 2: take-notes-draft_1
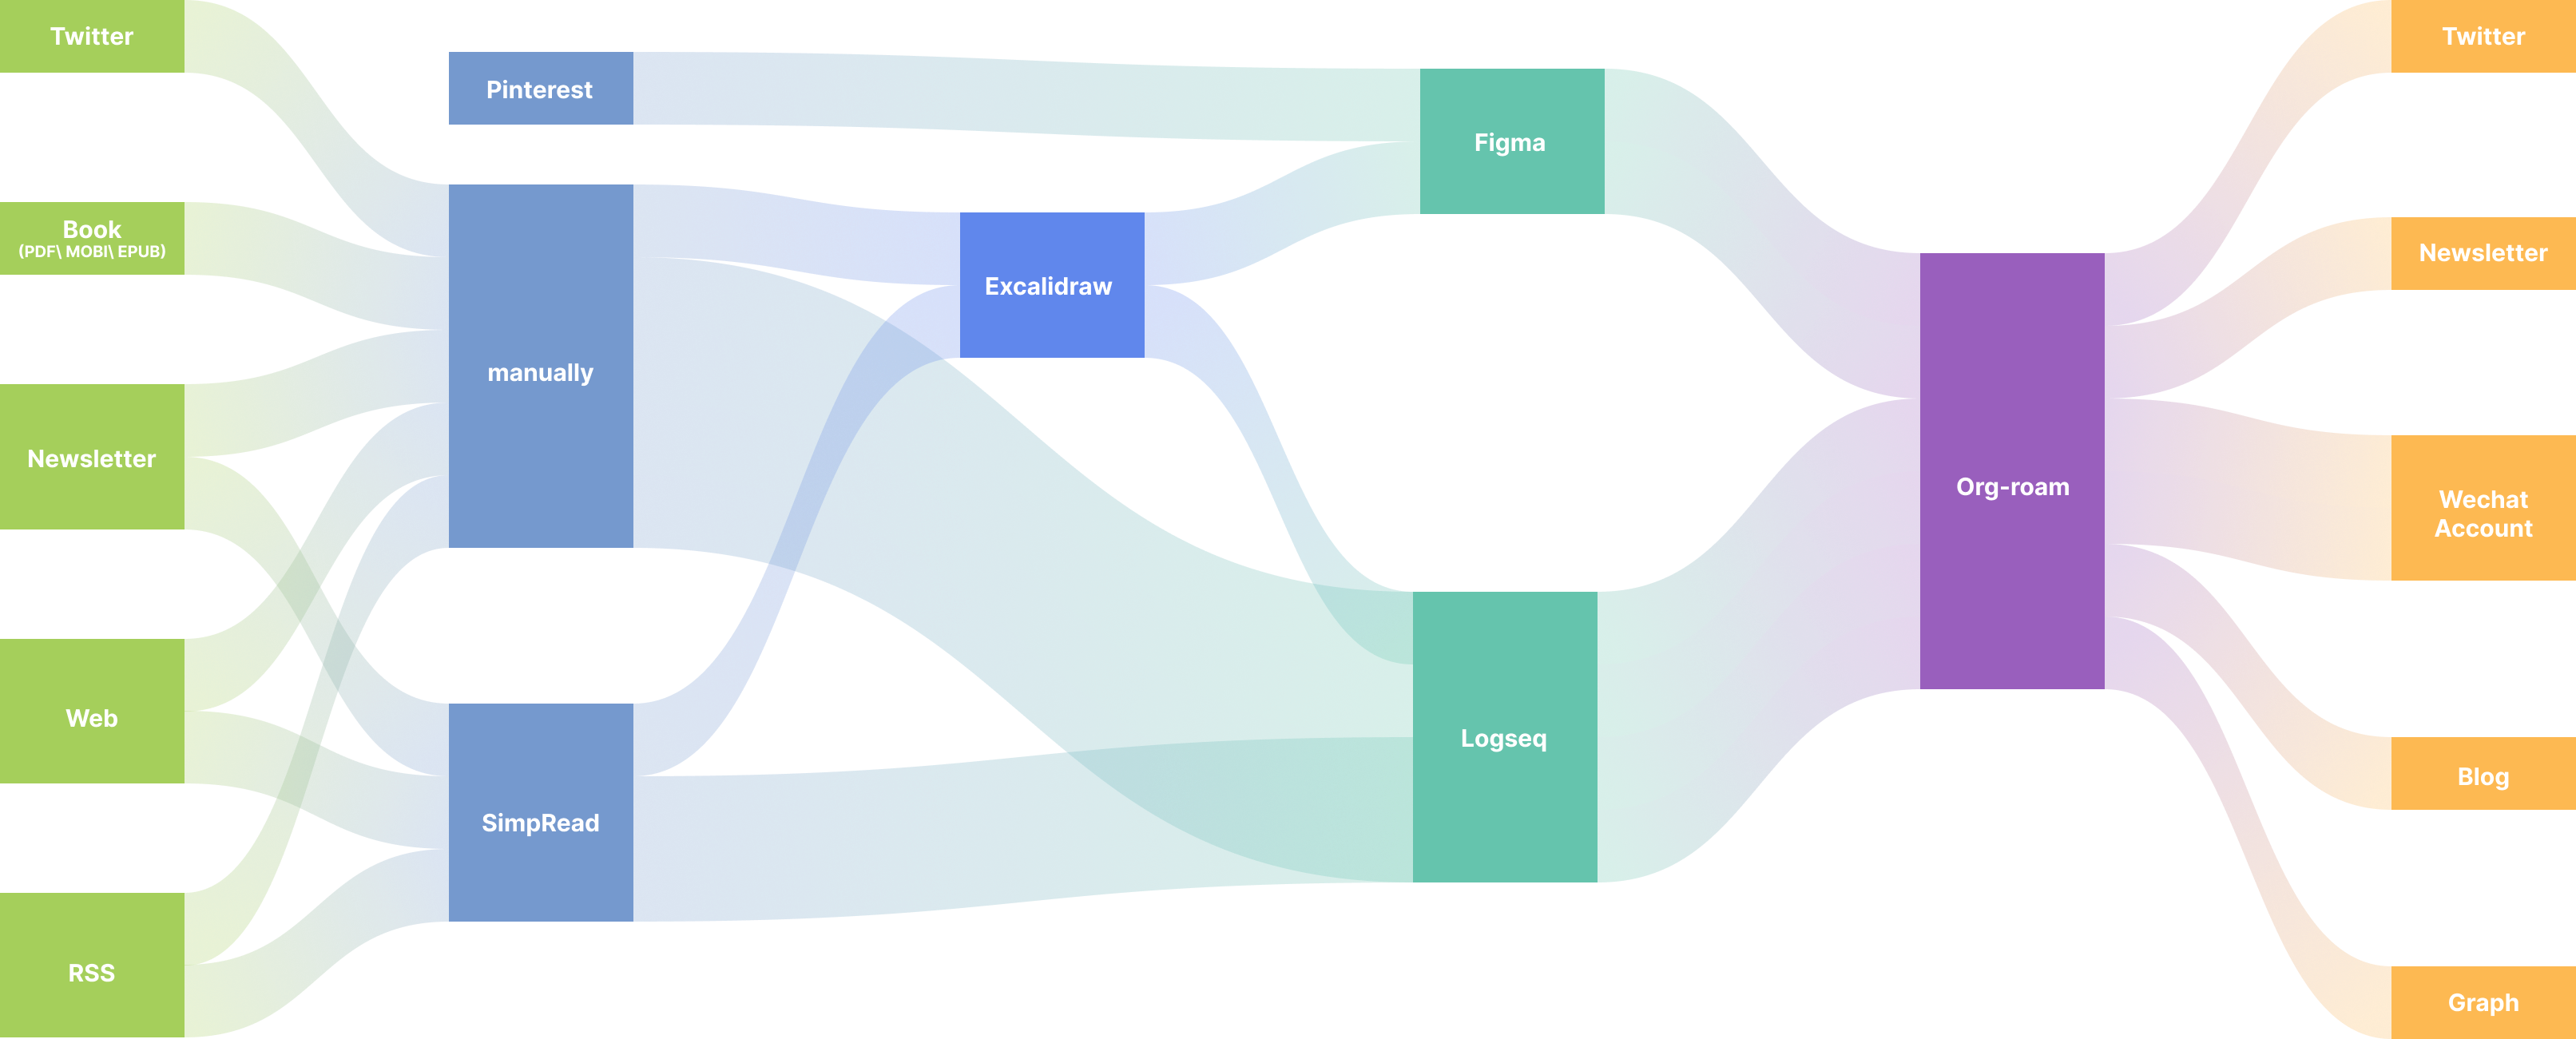
Figure 3: take-notes-sankey
-
技巧
- Connect 的渐变色是将颜色从 Solid 改为 Linear,然后把两端的色块拖动到 Node 处并改为对应 Node 的颜色。
- Connect 要尽量弧度舒缓,有美感;留白要均匀。
-
Heat Map
-
使用软件:Figma
-
展现过程中频次高低
-
案例:描述 GTD 和 Note-Taking 过程中思考频次高低。
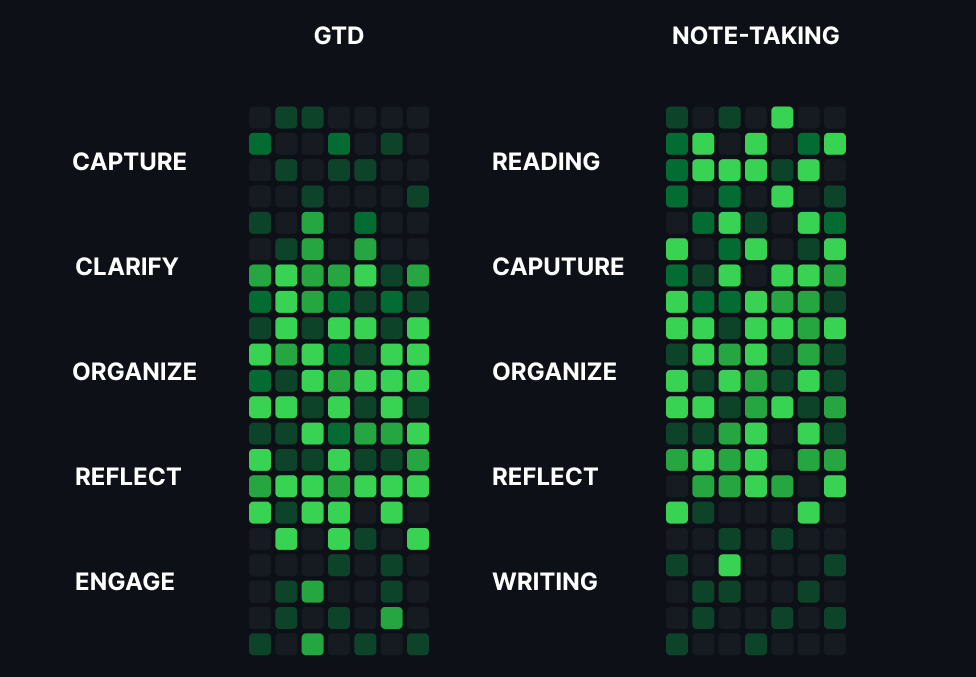
Figure 4: gtd_note_taking_dark
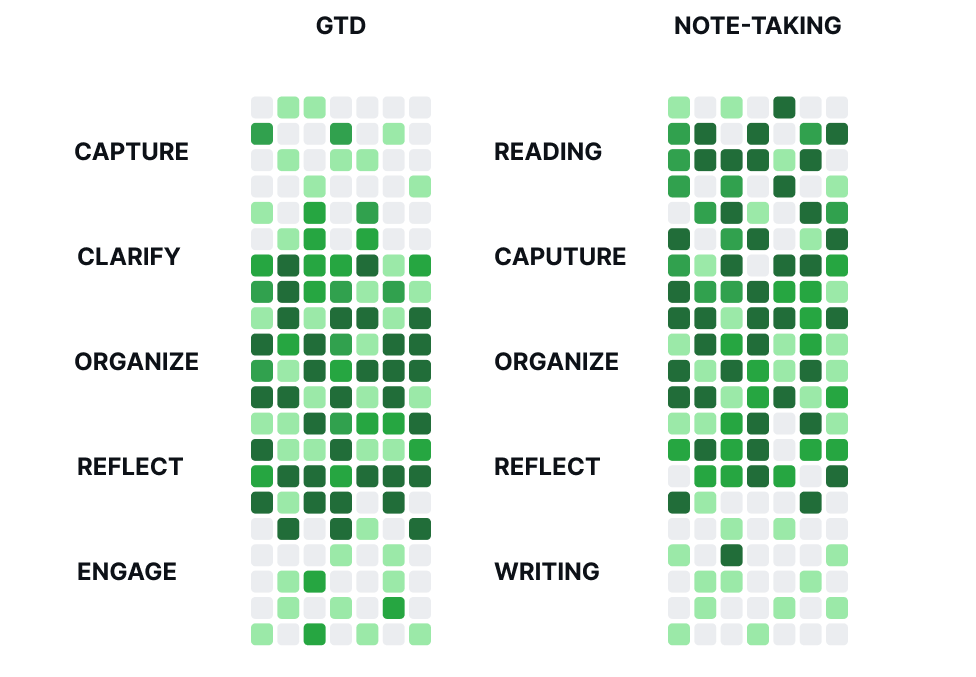
Figure 5: gtd_note_taking_light